Property Profile (Page)
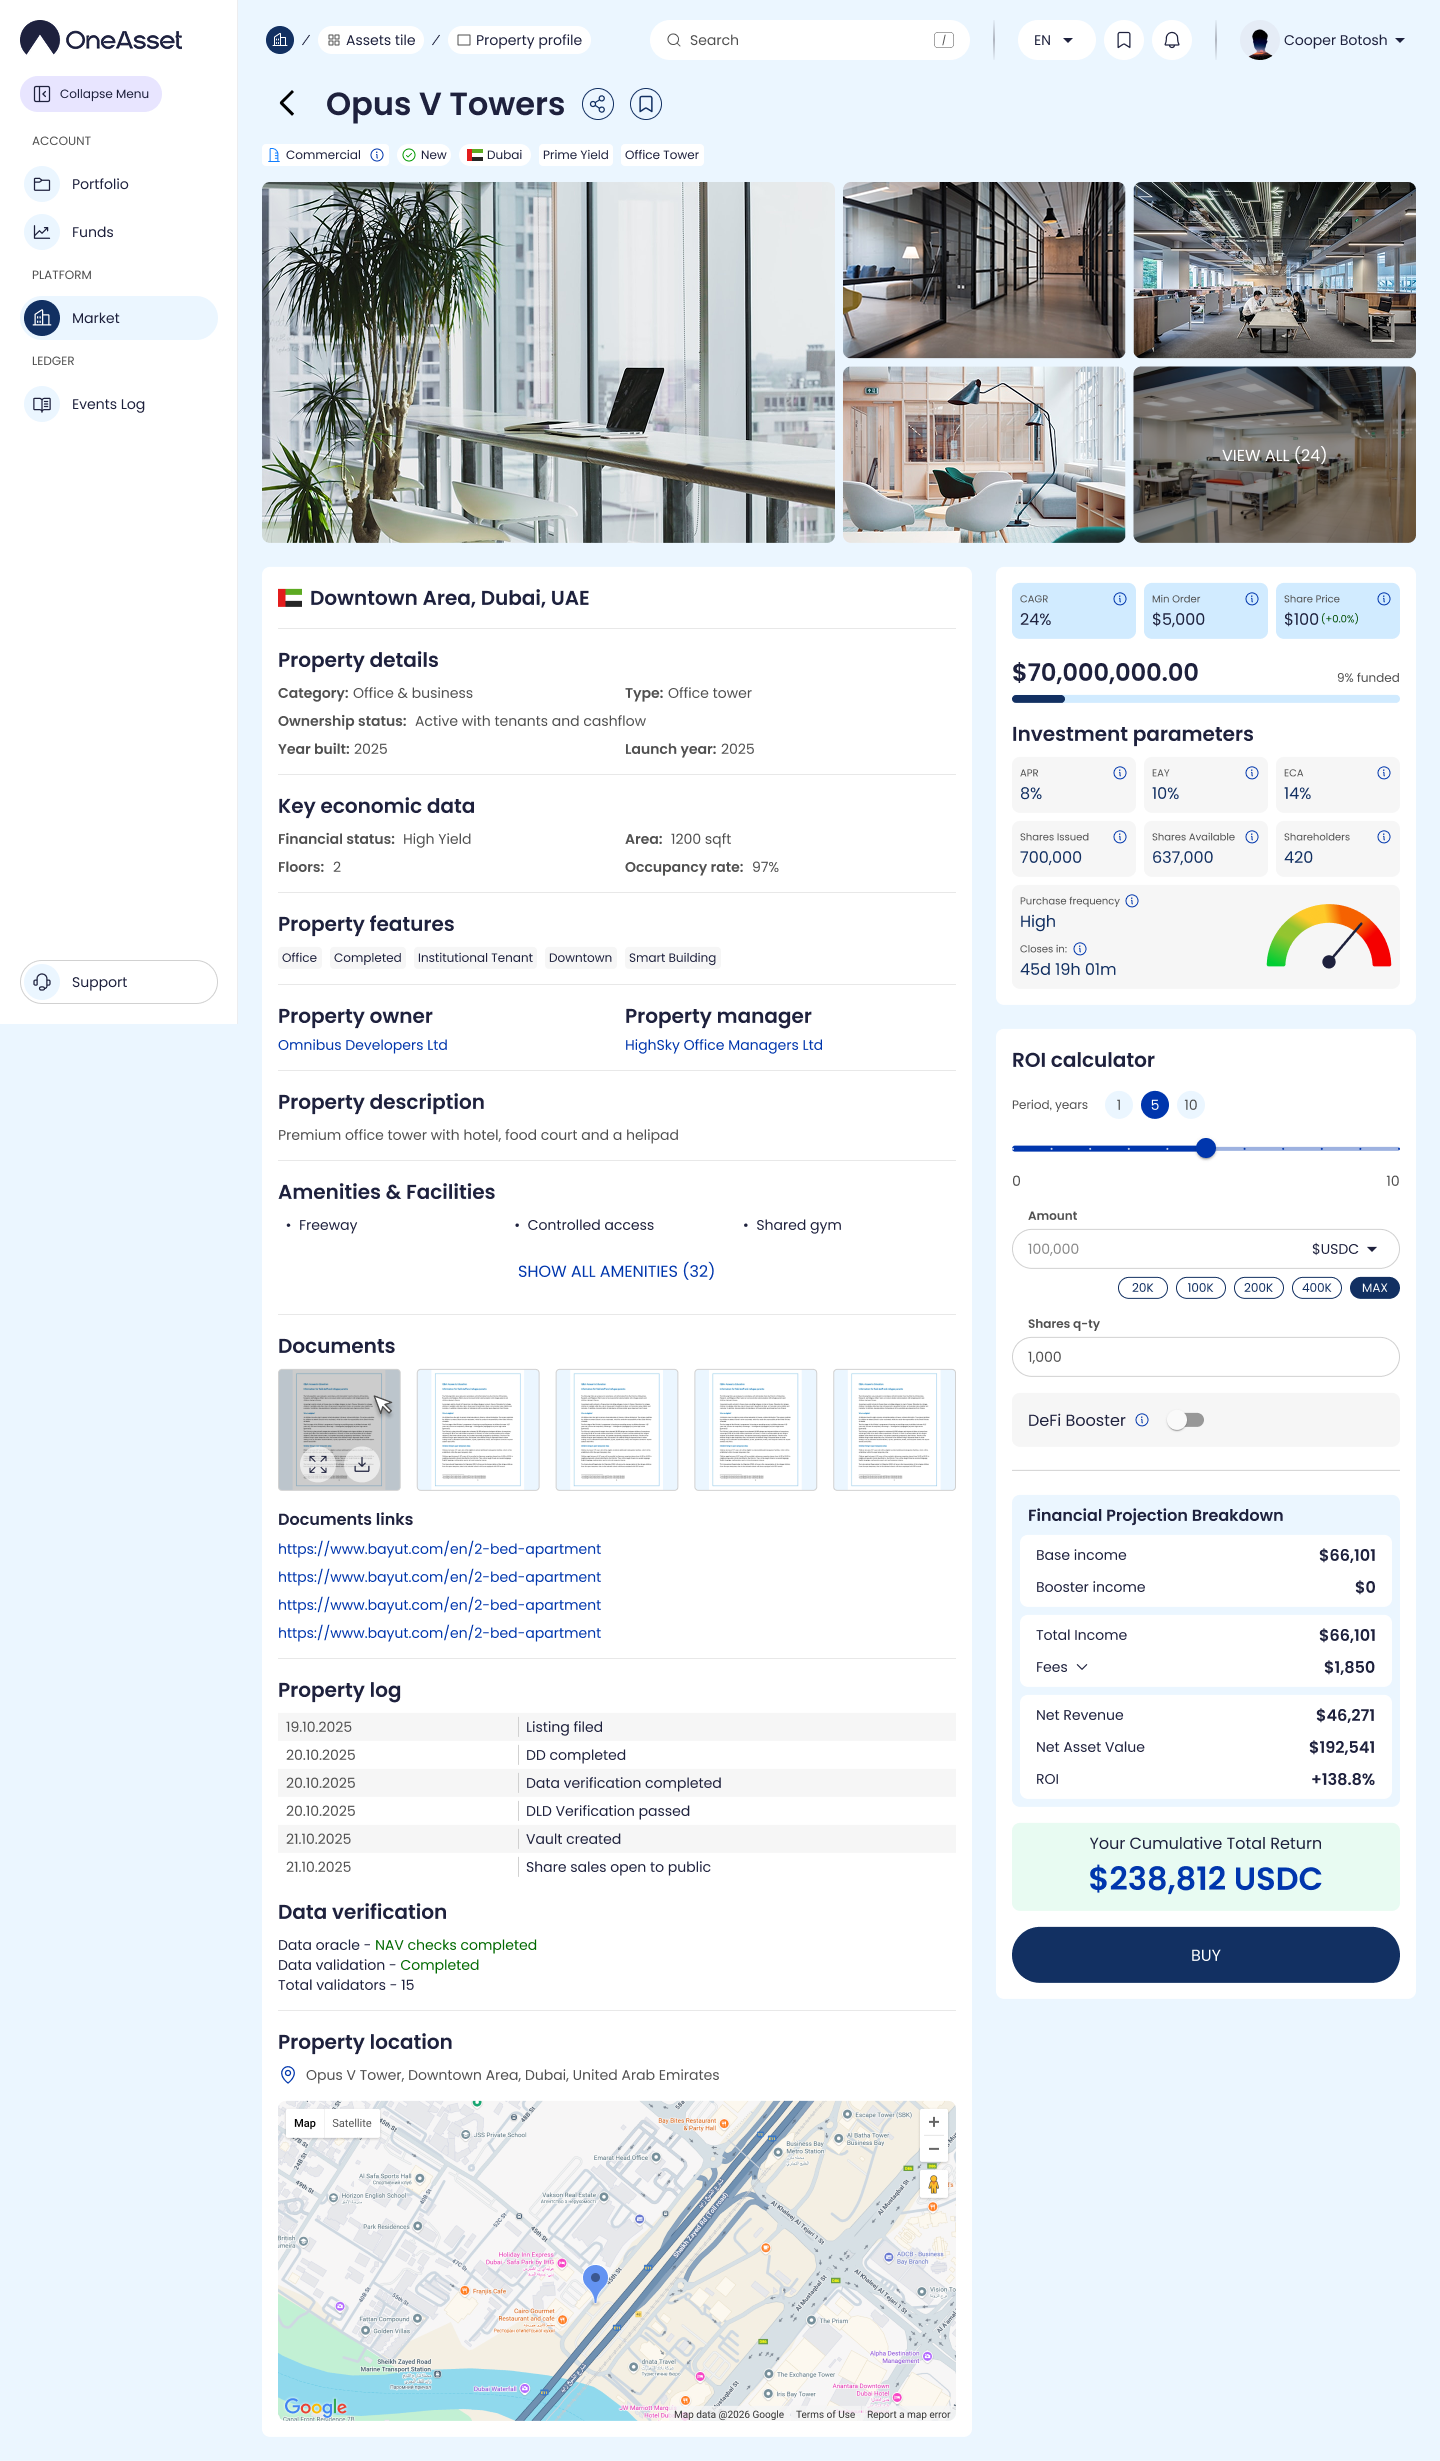
The Property Page is where an investor performs the final evaluation before buying. It consolidates the Property’s full dataset—tags, details, verification status, documents, activity log, and the ROI calculator—alongside the live investment panel.
Page header (identity + actions)
At the top of the page:
Property name (left)
Share icon and Bookmark/Watchlist icon (right)
Directly under the name, the page displays a compact “identity strip”:
Category icon
Financial tag
Sector/Type
Status
This keeps the most important context visible while the user scrolls.

Photo gallery
A full-width photo gallery provides visual context and credibility. This sits immediately after the header so users can understand what the Property looks like before reading metrics.
Location strip
The location strip presents the formatted location and country flag:
Left: area/district, city, country (abbreviated if needed for long names)
Right: country flag
Main content: two-column structure
The Property Page is structured into left column = information and right column = investment and ROI.
Left column — Property information
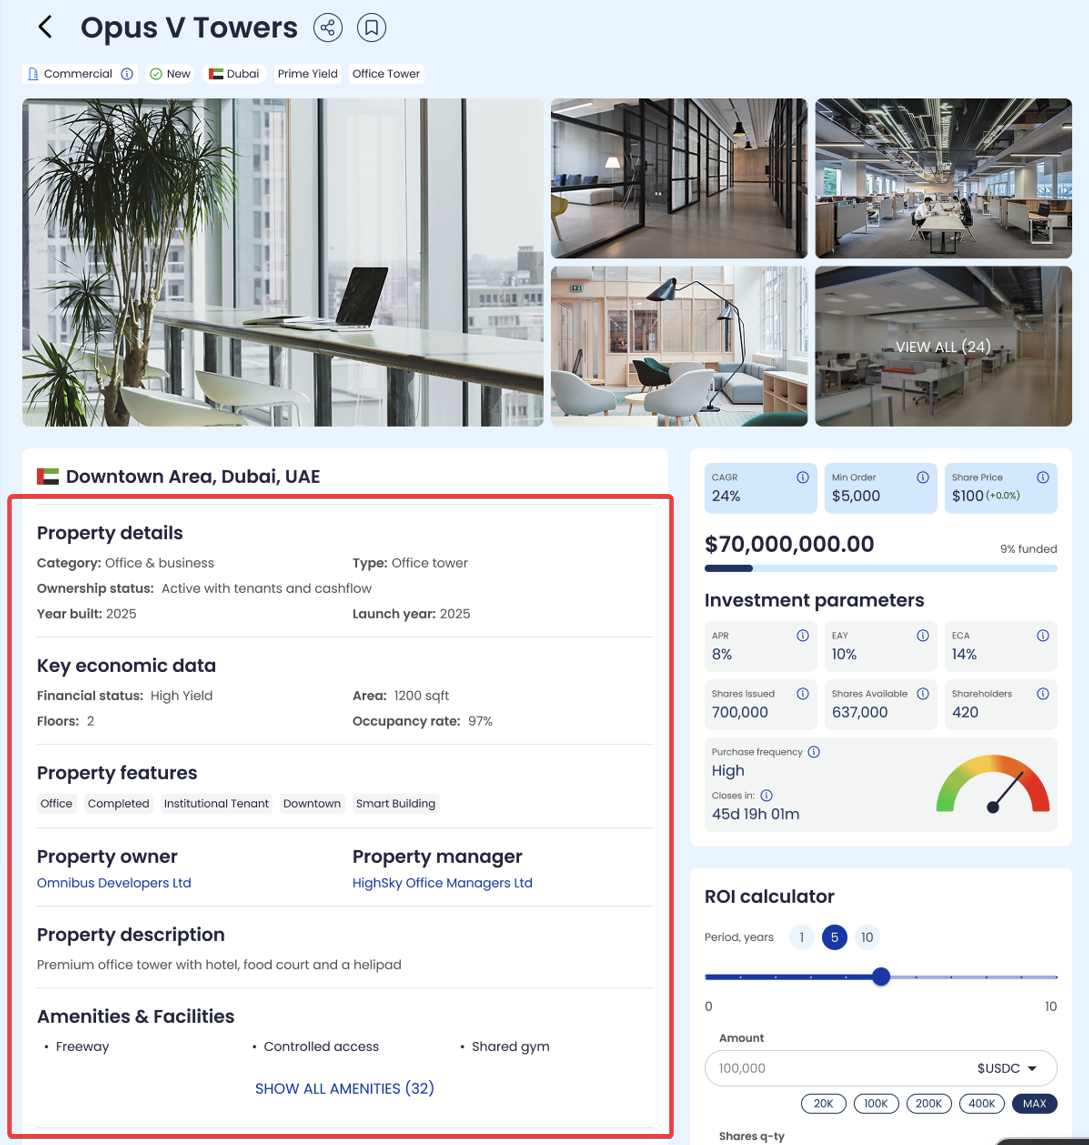
Property details (structured)
This section contains the core identifiers and factual attributes:
Category
Type
Ownership status
Year built
Launch year
Key economic data
This section provides operational and economic context:
Financial status
Area
Floors
Occupancy rate
Property features (tag chips)
A chip/tag row displays the Property’s key descriptors (the same “language” used for browsing and discovery). This is the high-signal summary of what makes the Property what it is.
Parties (Owner and Manager)
The page lists:
Property owner (linked to the company profile on OneAsset)
Property manager (linked to the company profile on OneAsset)
Property description
A readable description explains the Property in plain terms (what it is, how it is used, and what drives demand and income).
Amenities & Facilities
The page shows top 3 amenities as highlights, followed by <Show all amenities> which expands the full amenities list grouped by your amenity groups.
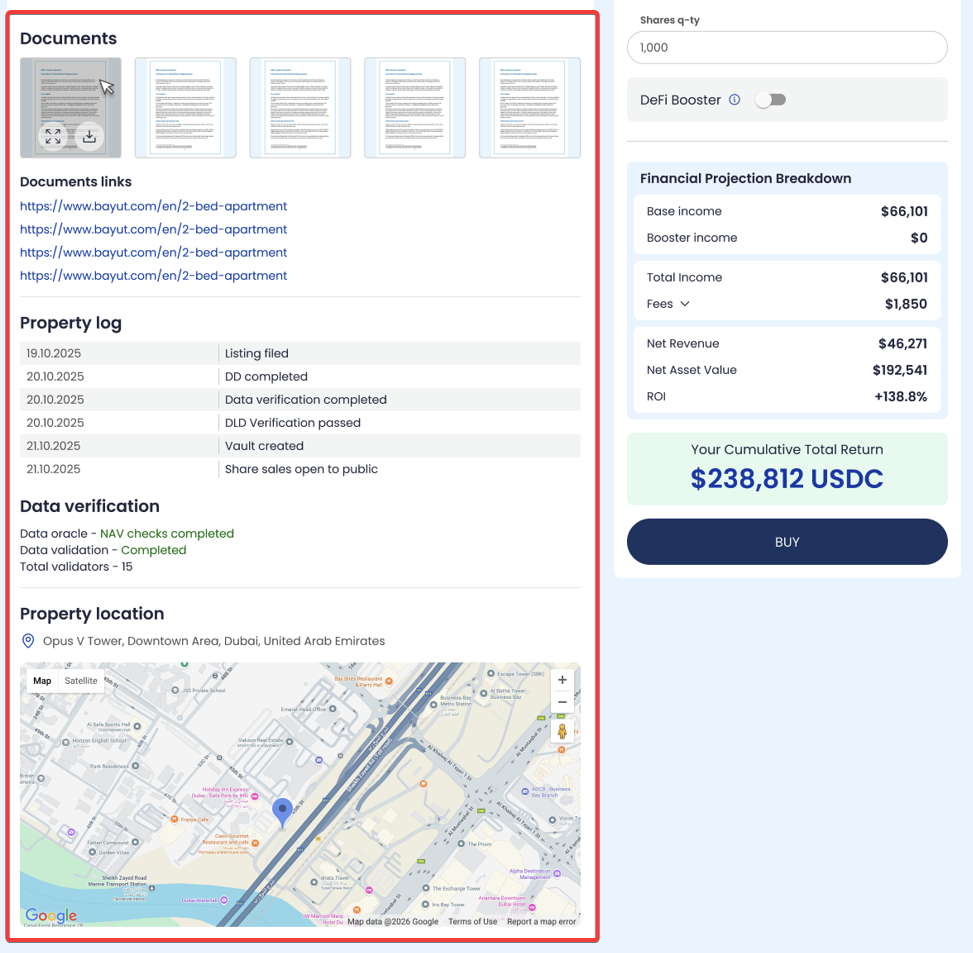
Documents
This section contains attached documents and external links relevant to the Property.
Property log (timeline)
The Property log lists dated milestones and events such as listing progress, due diligence completion, verification completion, and vault creation. Each entry is formatted:
Date — Event — (optional link)
Data verification
The verification block summarizes the current verification state:
Oracle verification status (e.g., “NAV checks completed”)
Validator verification status
Total validators / total verifications
Property location + map
The page displays the full address and provides a map designed to be easy to use for navigation.
Right column — Investment + ROI
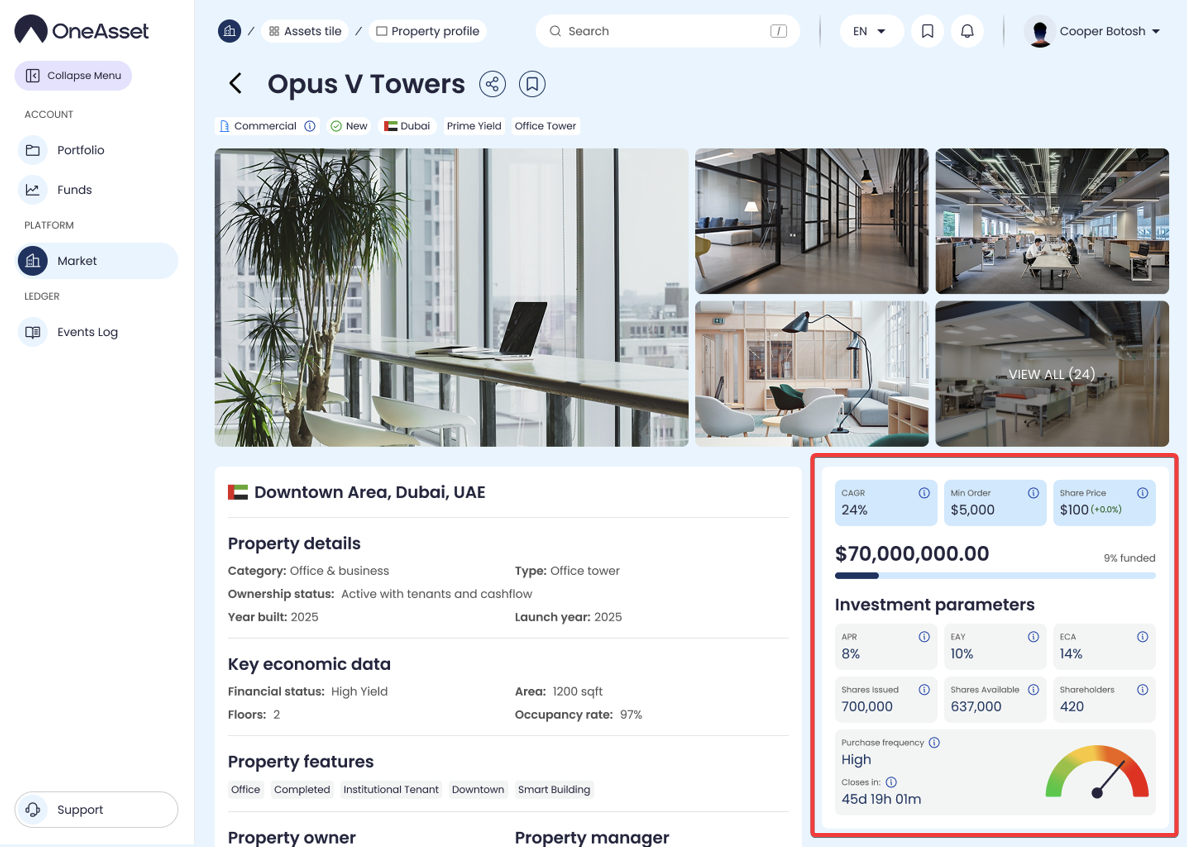
Investment summary panel
This panel mirrors the card’s headline metrics but adds more detail in one place:
CAGR / ECA / EAY (headline returns context)
Share Price (+/-% change)
Onchain Vault value (USDC)
Funding progress bar
Shares issued / shares available / shareholders
Purchase frequency gauge
Closes in countdown timer
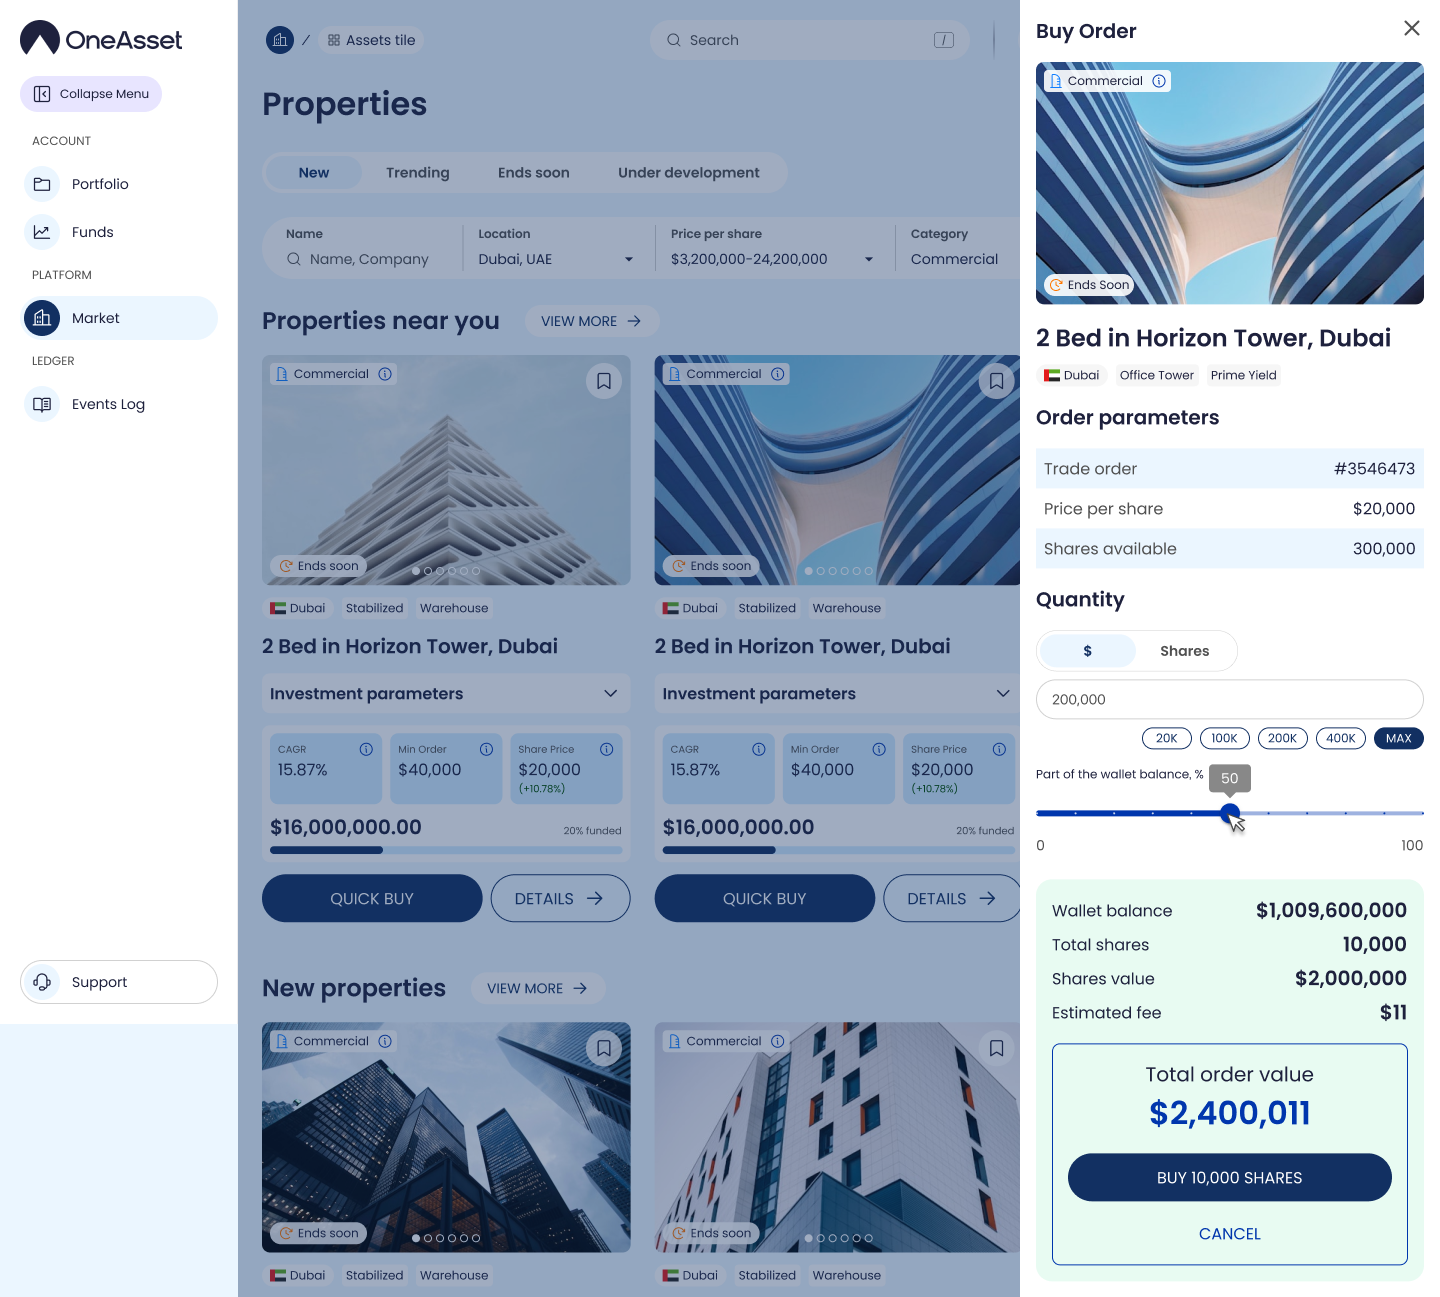
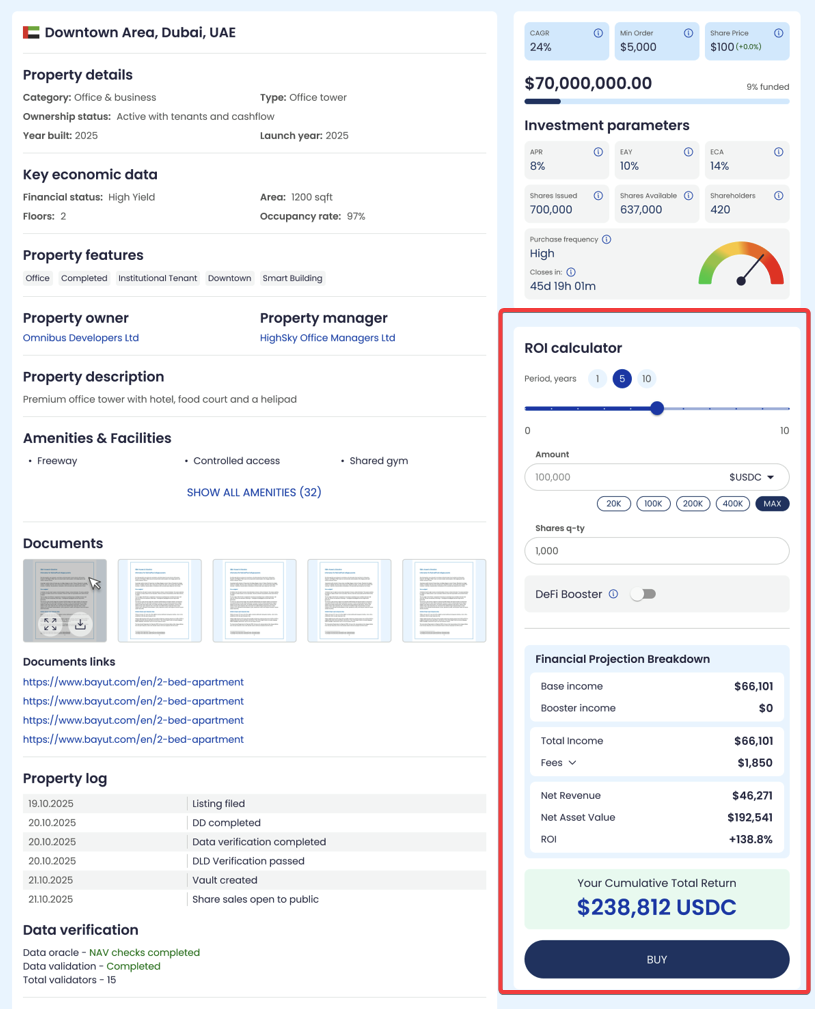
ROI calculator
The ROI calculator estimates potential outcomes over a selected horizon using the Property’s metrics and the user’s input amount.
Time horizon tabs
The calculator provides these preset horizons:
1Y
5Y
10Y
Inputs and derived values
Enter amount (USDC)
The user enters an investment amount. The UI respects min/max constraints.
Shares quantity
Automatically calculated as:
Shares q-ty = Enter amount / Share Price
ROI outputs (exact fields)
The calculator outputs:
Base income (USDC): projected income from the Property’s base net yield component for the selected horizon.
Booster income (USDC): projected incremental income from the booster based on allocation.
Total Income (USDC): base income + booster income.
Fees (USDC): total fees for the selected horizon (expandable breakdown).
Net Revenue (USDC): total income − fees.
ROI (%): automatically calculated from net revenue and the investment for the selected horizon.
End NAV (USDC): projected end value of holdings after applying ECA over the selected horizon.
Your Cumulative Total Return (USDC): net income over the horizon + end NAV.
Metric meanings (as displayed on the Property Page)
These are the canonical definitions used across the page:
EAY (Gross Income Yield): gross income yield assumption.
APR (Net Income Yield): net income yield assumption after haircuts; used for distribution modeling.
ECA (Estimated Annual Capital Appreciation): annual appreciation assumption.
CAGR (Gross, pre-fees/taxes): CAGR = EAY + ECA
Tooltip: “Estimated gross annual return before fees and taxes. Calculated as Gross Income Yield (EAY) + Capital Appreciation (ECA).”Total Return tooltip: “Includes distributions. Not annualized. Distributions assumed paid out (not reinvested).”
Buy action
The ROI calculator panel ends with a clear <Buy> CTA that enters the buy flow from the Property Page.