Property Card
The Property Card is the compact listing unit shown in the Market feed. It’s designed for fast scanning: investors can identify the asset category, check the headline return metric, see funding progress, and save the Property to Watchlist—without opening the full Property Page.

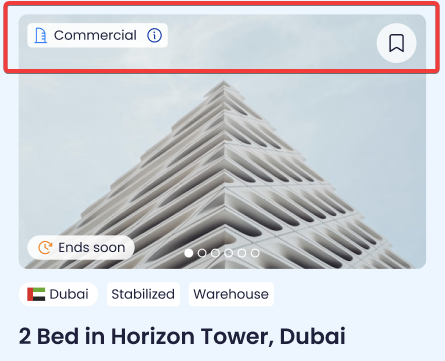
Media header (image + overlays)
Each card starts with a Property image (supports a gallery) and two semi-transparent overlays:
Category icon (top-left): a semi-transparent category badge placed on the image.
Watchlist icon (top-right): a semi-transparent bookmark icon that adds/removes the Property from Watchlist.
These overlays stay subtle so the image remains the primary visual element while still conveying category and allowing quick saving.
Title row (identity + quick context)
Below the image, the card shows the identity and context in a single row:
Property name
Financial tag
Type
Status
Location
This row is intentionally dense: it lets investors read the “what is this?” and “where is it?” in one glance.

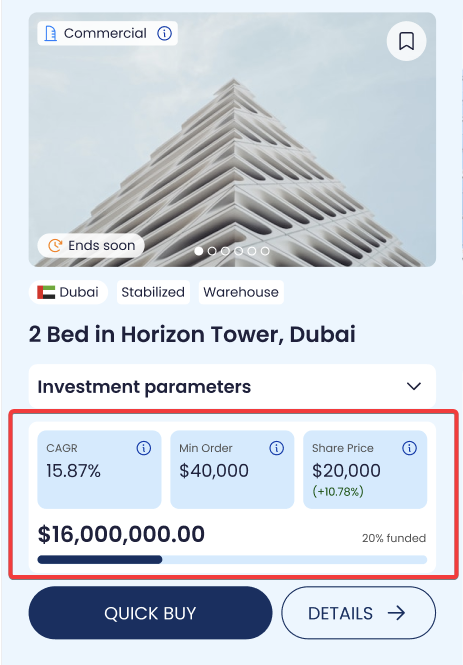
Investment summary (collapsed view)
The collapsed view shows the essential investment snapshot:
Left side
Onchain Vault value / offering size (USDC)
Funded percentage
Funding progress bar
Right side
CAGR (%)
Min Order (USDC)
Share Price (USDC) + price change (%)
This is the card’s primary decision set: size, progress, and headline return.
Investment Parameters (expandable block)
The card includes an “Investment parameters” label with a down-arrow (▼). Clicking the arrow expands the card to show more detailed metrics and supply stats:
Top row
APR (%)
EAY (%)
ECA (%)
Bottom row
Shares Issued
Shares Available
Shareholders (unique wallets)
This expanded block turns the card into a mini fact sheet without forcing a page navigation.
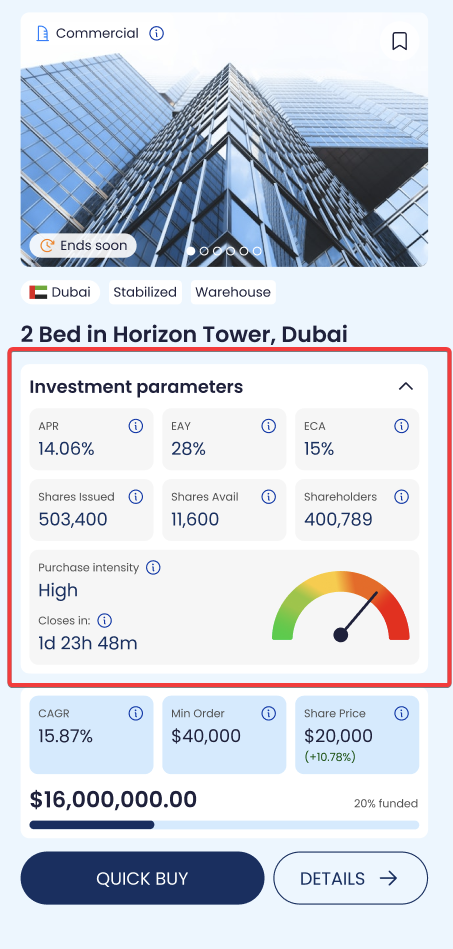
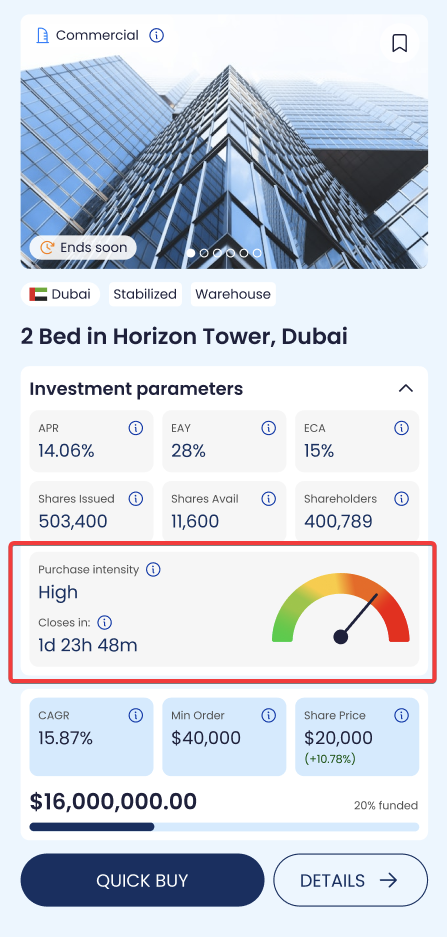
Purchase Frequency indicator
At the bottom of the expanded view, the card shows:
Purchase Frequency (Low/Medium/High/Extreme)
A frequency gauge (visual indicator)
Countdown to raiser close
This is a simple liquidity/activity signal to help users understand whether the Property tends to see frequent share purchases. The UI exposes the signal, not the math.
Metric meanings (as displayed on the card)
To keep interpretation consistent across the platform:
EAY (Gross Income Yield): the gross income yield assumption.
APR (Net Income Yield): the net income yield assumption after haircuts; used for net distribution modeling.
ECA (Estimated Annual Capital Appreciation): annual appreciation assumption for value growth.
CAGR (Gross, pre-fees/taxes): CAGR = EAY + ECA
Tooltip: “Estimated gross annual return before fees and taxes. Calculated as Gross Income Yield (EAY) + Capital Appreciation (ECA).”Share Price: current price per share; % change shows the movement vs the prior reference price.