Portfolio
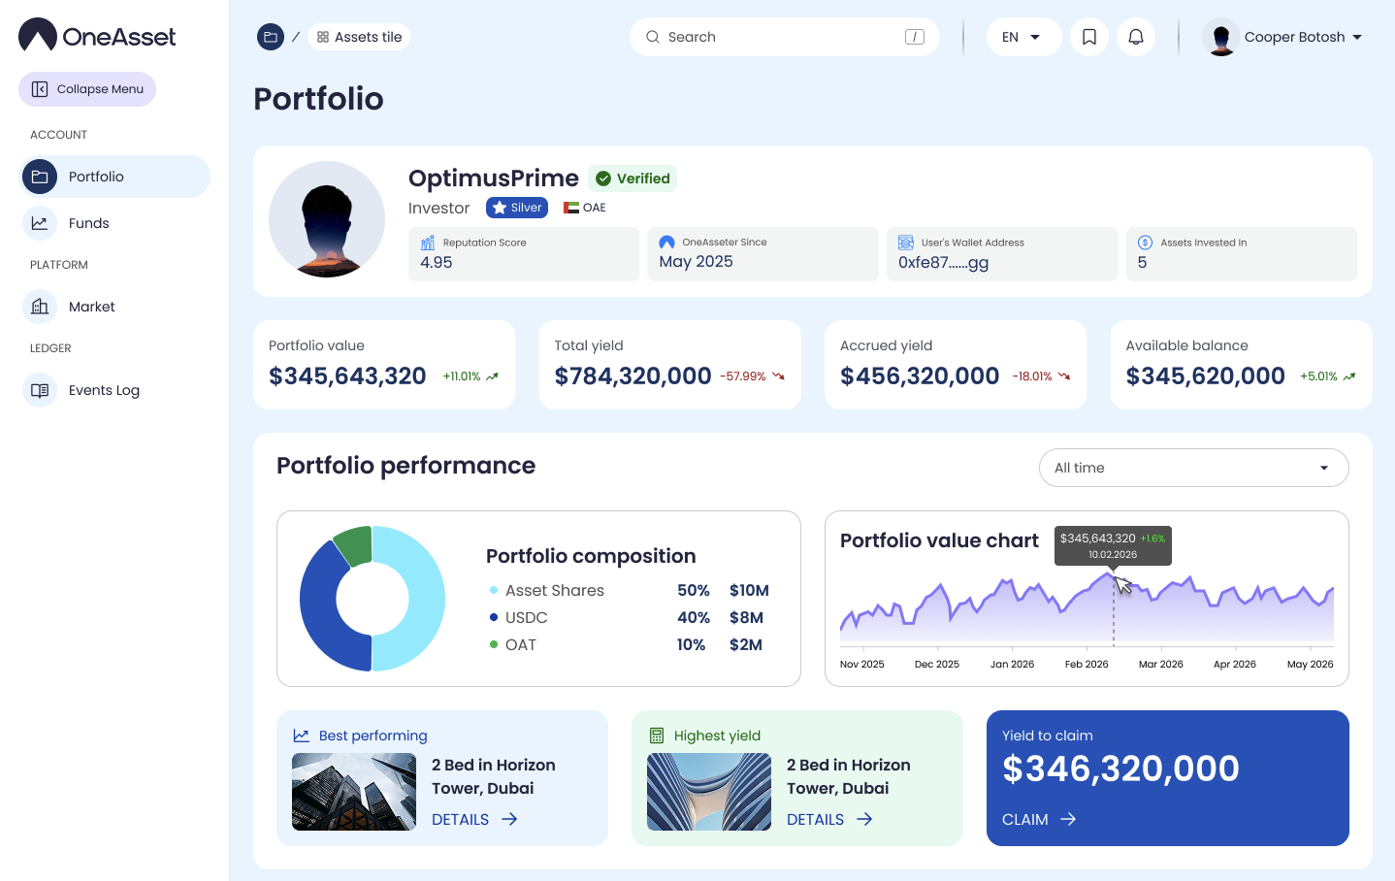
The Portfolio section provides a consolidated view of your holdings, balances, and performance. It is the primary workspace for monitoring portfolio value, yield metrics, and owned assets.
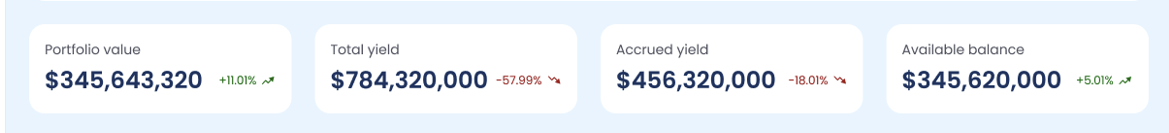
Portfolio summary
The top summary blocks display Portfolio Value, Total Yield, Accrued Yield, and Available Balance (USDC).
Values update as portfolio activity and yield accruals are recorded.
KPI definitions
Portfolio Value: total value of all holdings (Assets + USDC + OAT), displayed in USD.
Total Yield: total yield generated by your holdings (includes settled/credited yield and accrued yield).
Accrued Yield: yield earned that is recorded but not yet credited/settled to Available Balance (USDC).
Available Balance (USDC): currently available USDC balance shown in the account.
Performance and composition
Use the timeframe selector (1D, 1W, 30D, All time) to adjust performance views.
Composition panels summarize portfolio allocation (Assets / USDC / OAT) and asset category distribution.
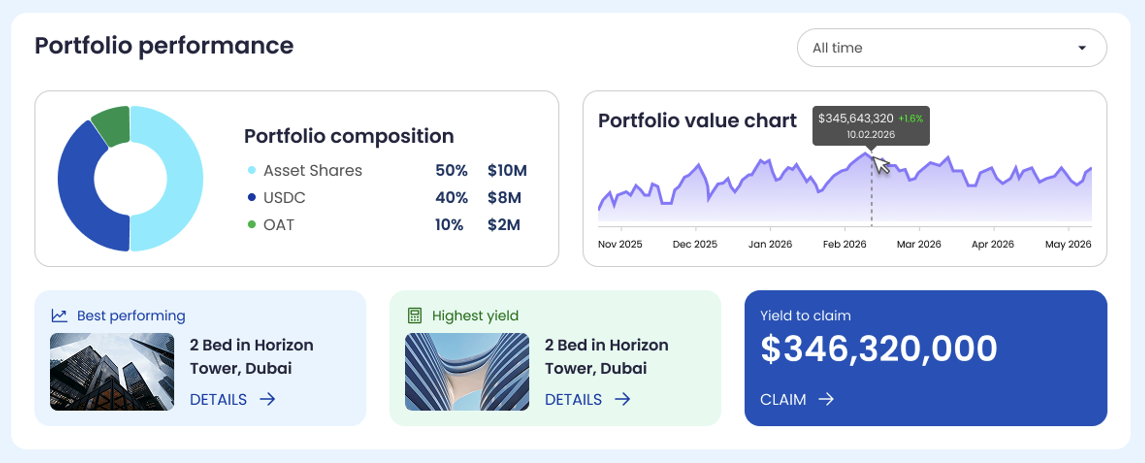
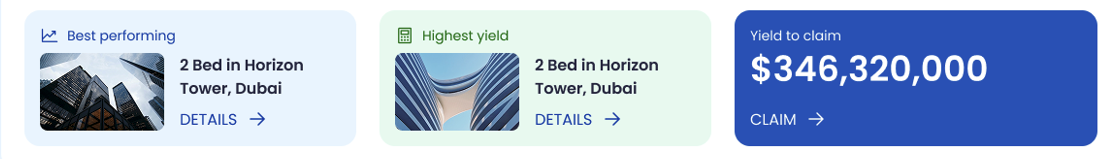
Portfolio performance highlights
Best performing (asset): shows the asset with the strongest share price performance over the selected timeframe (price change only; excludes yield).
Highest yield (asset): shows the asset with the highest yield metric over the selected timeframe based on your holdings (as displayed in the UI).
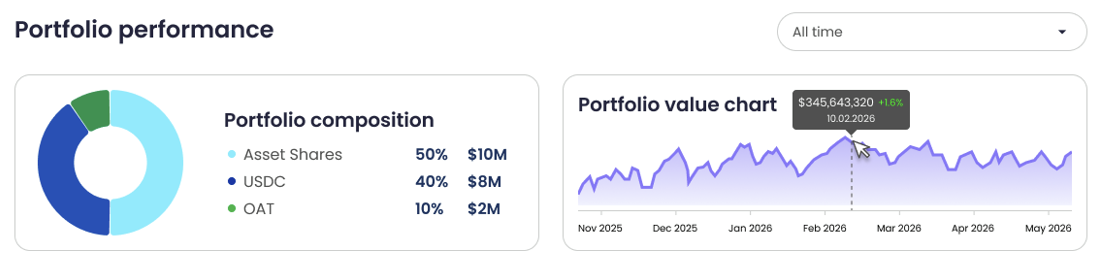
Portfolio value chart
The portfolio value chart displays the total portfolio value over time (Assets + USDC + OAT) in USD.
Hovering a point shows the value and its percentage deviation vs the previous day.
Portfolio composition
The composition chart breaks down portfolio allocation into Assets, USDC, and OAT with % and USD values.
Values reflect the current portfolio snapshot for the selected timeframe.
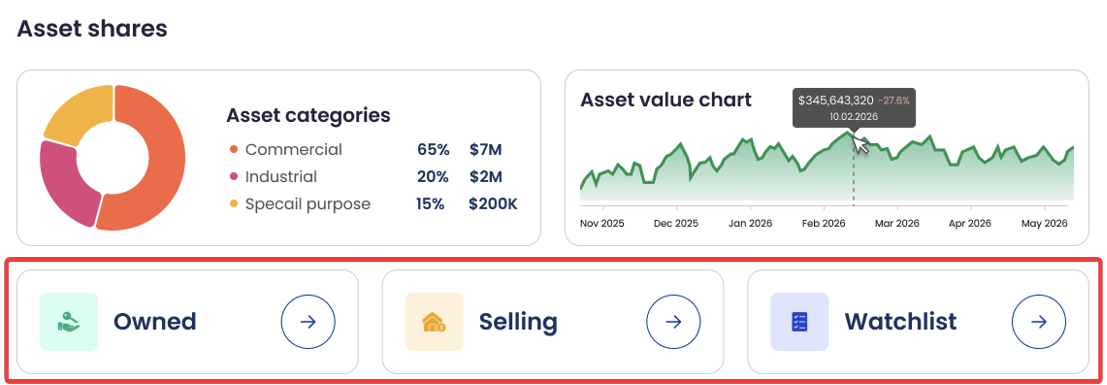
Assets categories
The asset categories chart breaks down owned asset value by category (for example: Commercial, Industrial, Special Purpose) with % and USD values.
Categories reflect the classification shown on each asset’s page.
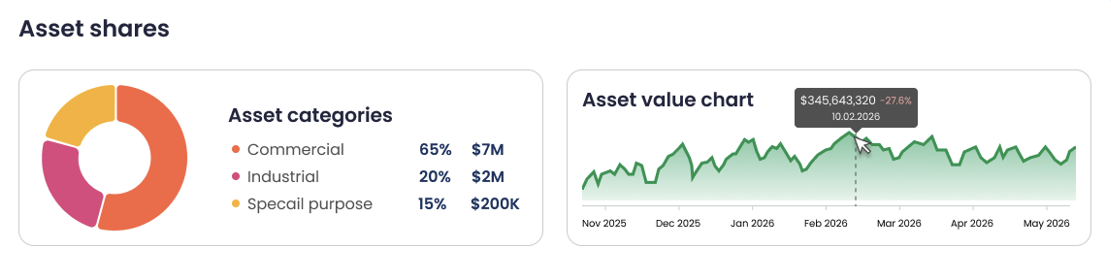
Assets value chart
The assets value chart displays the total value of assets only over time in USD.
Hovering a point shows the value and its percentage deviation vs the previous day.
Holdings tabs
Use the tabs to switch portfolio view.